Meteorium
日本語マニュアル
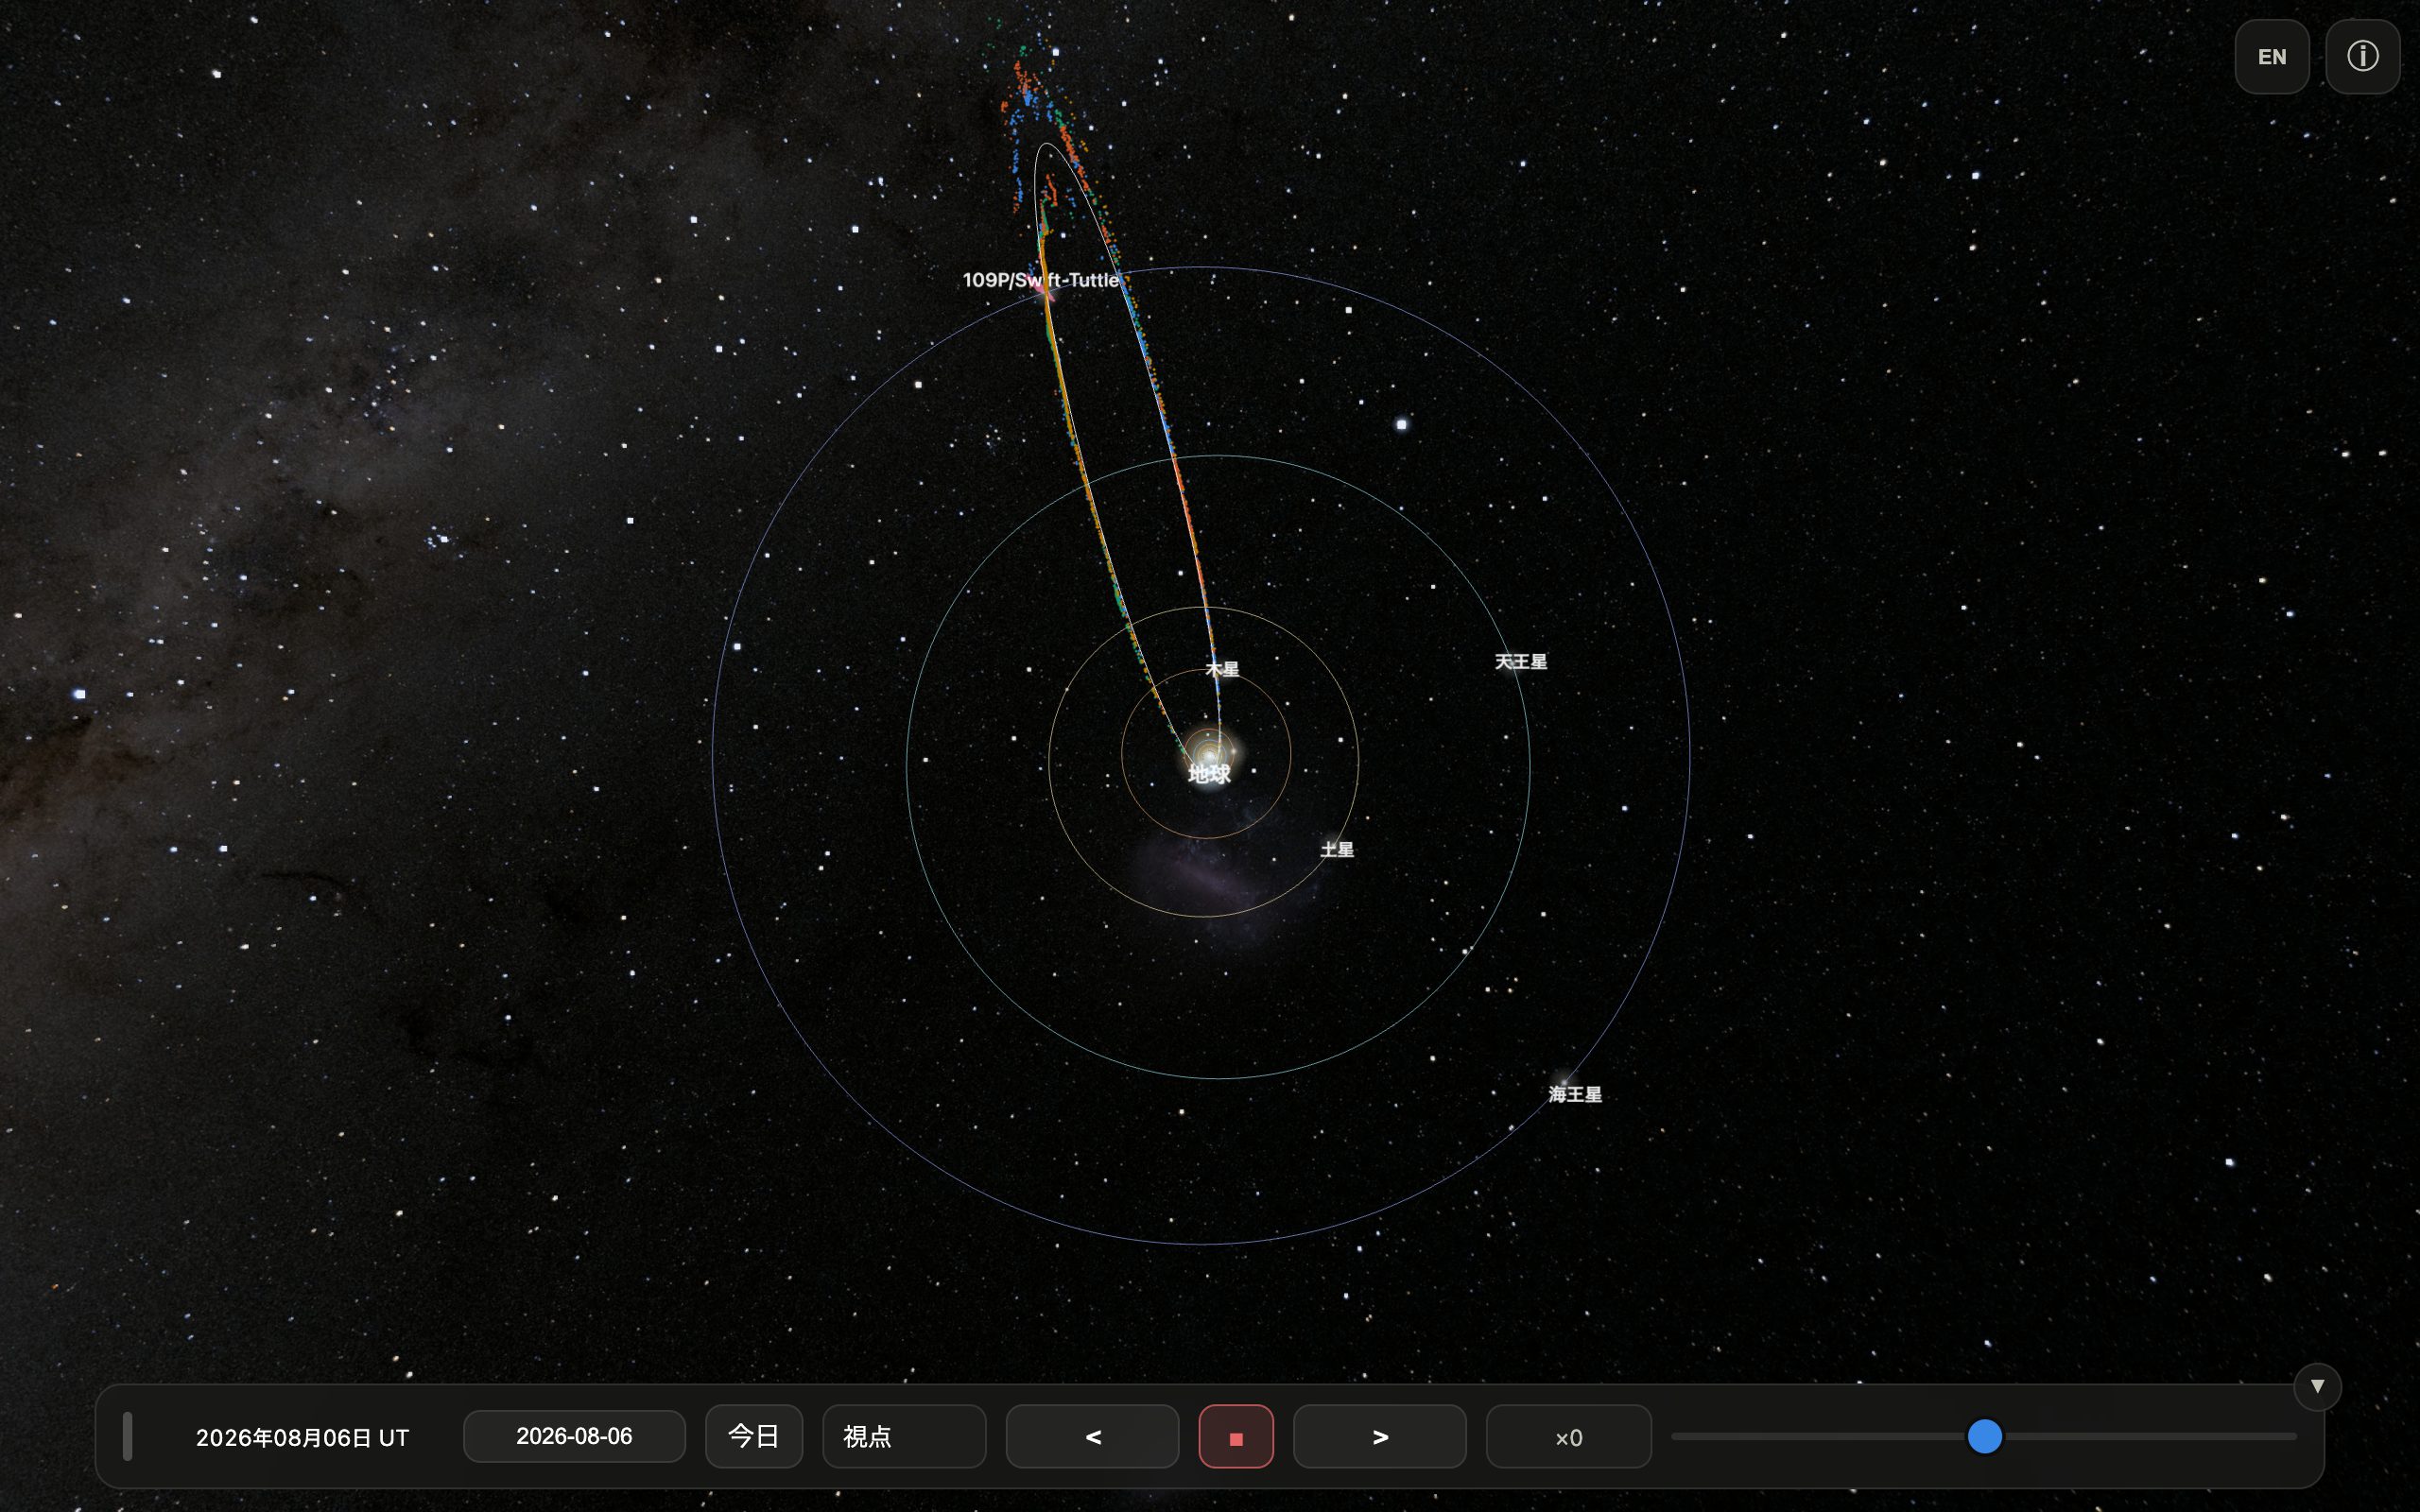
Meteorium は、流星群のもとになる「ダストトレイル」(彗星が軌道上に残した塵の帯)を 科学計算に基づいて 3D 表示する天文アプリです。本アプリには、ペルセウス座流星群の母彗星 109P/スウィフト・タトルが残した 8回帰ぶん(1079・1209・1344・1478・1609・1736・ 1862・1992年)のダストトレイル 60,000 粒子が収録されています。粒子の軌道は REBOUND/ReboundX による 軌道積分(惑星重力+太陽放射圧)で計算し、背景の空には NASA「Deep Star Maps 2020」を 使用しています。軌道計算も描画もすべて端末内で行い、データ収集・広告はありません(公開データを取得するときだけ通信します)。
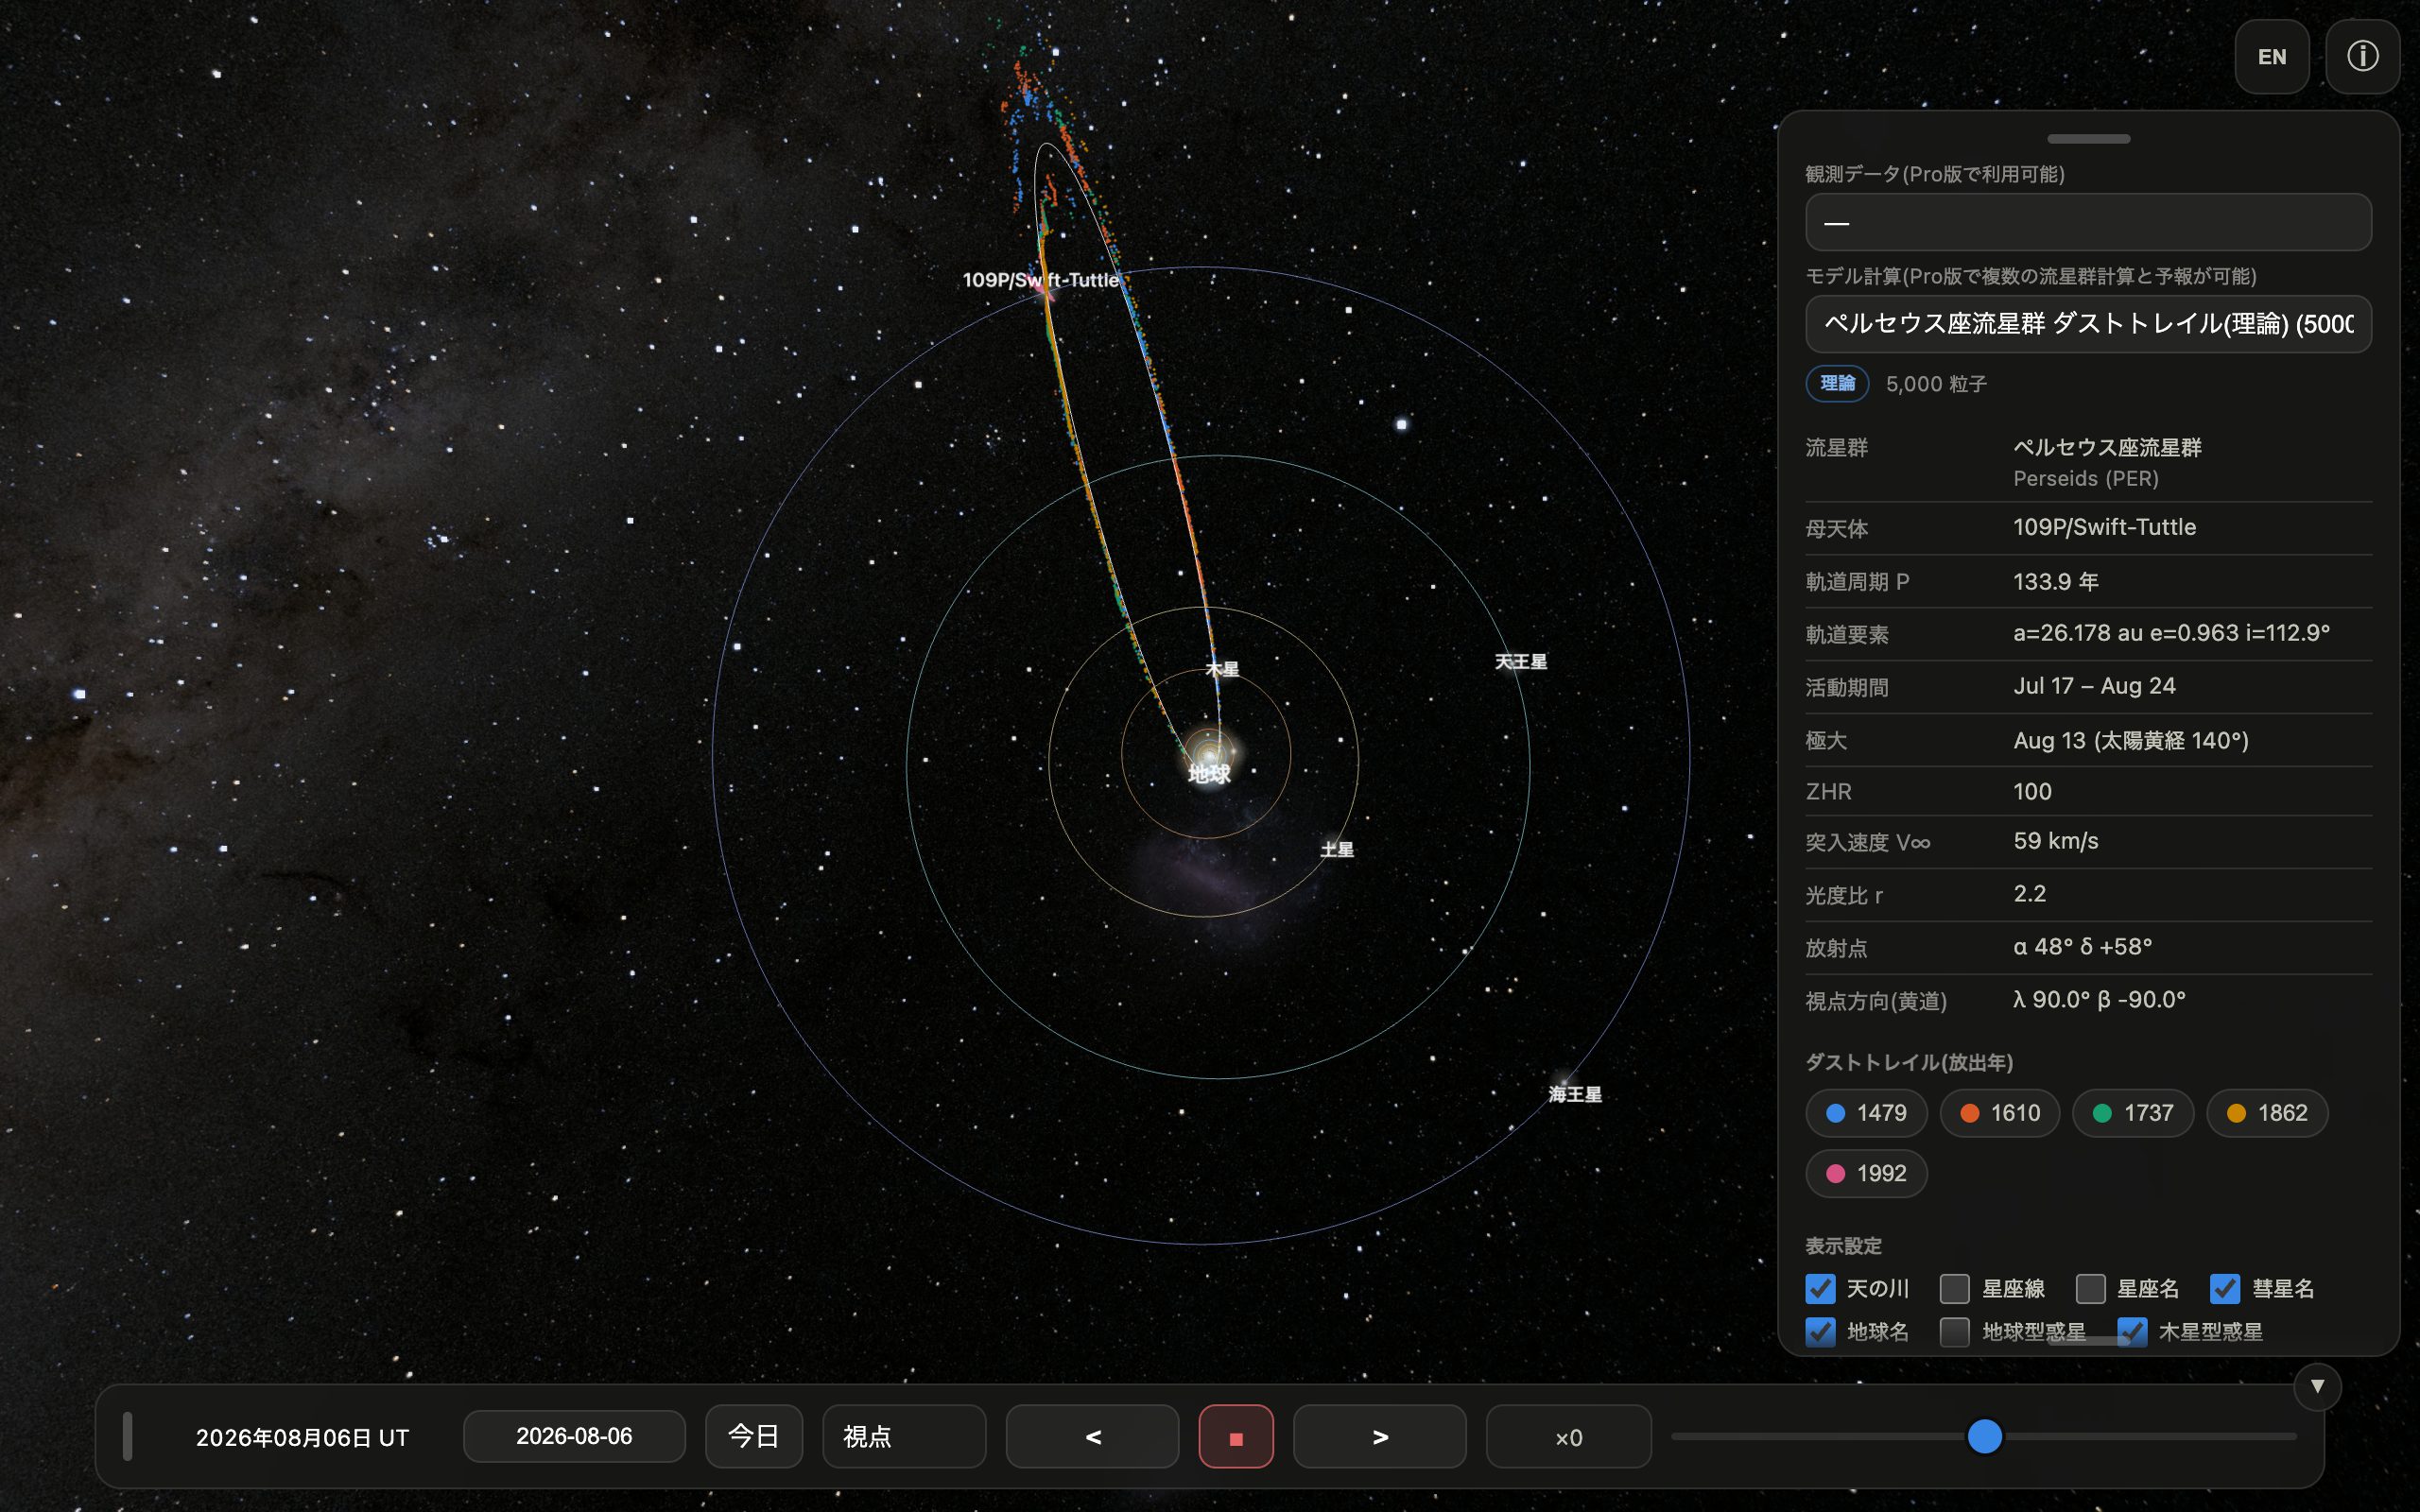
画面の構成
| 場所 | 内容 |
|---|---|
| 中央 | 3D 表示(ドラッグ=視点回転、ピンチ/ホイール=ズーム) |
| 右上 | EN/JP(言語切替)、ⓘ(パネル開閉) |
| 右パネル | データセット・トレイル凡例・表示設定・視点・粒子設定 |
| 下部バー | 日時(UT)・日付入力・今日・視点・時間操作 |
パネルと下部バーはつまみをドラッグして移動できます。パネル下端のつまみで表示の長さも 調整できます。
- 下部バー右上の ▼ ボタンでバー全体を畳めます(小さな ▲ ボタンだけが残り、 タップで復元)
- iPhone を横向きにすると、速度スライダーは下部バーの2段目に全幅で表示されます
- 画面を回転してパネルが画面外に出た場合は、自動で定位置に戻ります

ダストトレイル(放出年)
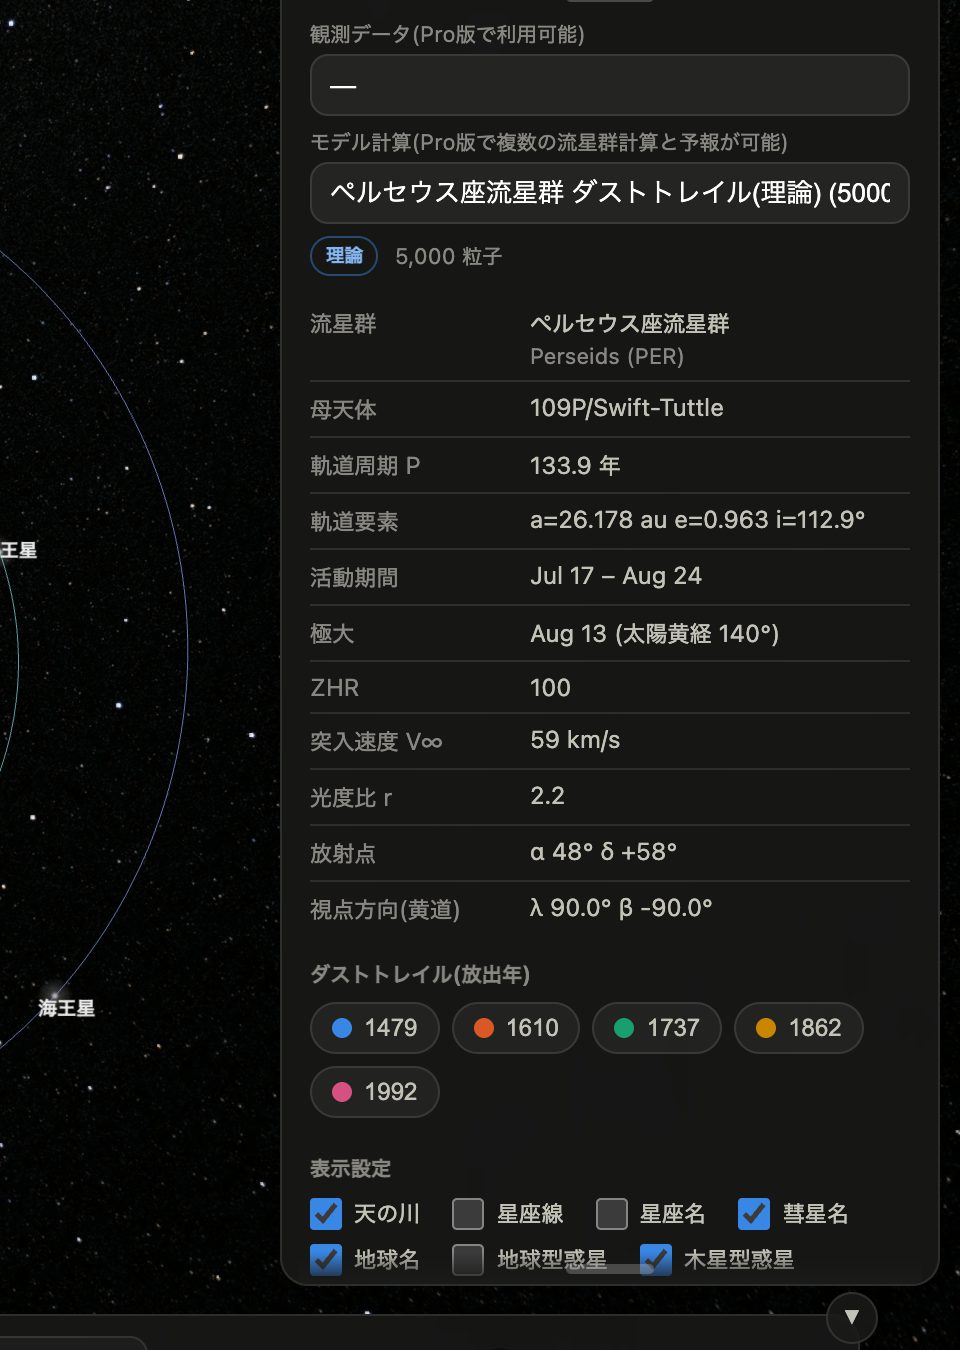
凡例の色付きチップは放出年ごとのトレイルです。タップで個別に表示/非表示を切り替え られます。「1992」は前回回帰(1992年12月12日)の最も新しい塵、古い年ほど軌道に沿って 広がっています。
表示設定
天の川/星座線/星座名/彗星名/地球名/地球型惑星/木星型惑星/惑星/軌道線/ 粒子/放射点。起動時の既定値では星座線・星座名・地球型惑星・放射点が OFF です (本アプリは毎回この既定値で起動します)。
視点
| ボタン | 動作 |
|---|---|
| 黄道面北 / 南 | 真上/真下から。押すたびに 45° ずつ回転 |
| 黄緯変化 | 現在の黄経を固定し、押すたびに黄緯を 30° ずつ変化 |
| 太陽 | 太陽中心に固定。押すたびに ①春分点方向 → ②彗星追尾 → ③地球追尾。 左上に現在モードを表示。ドラッグしても追尾は継続 |
| 地球 | 地上から放射点方向を見る観察視点(下記) |
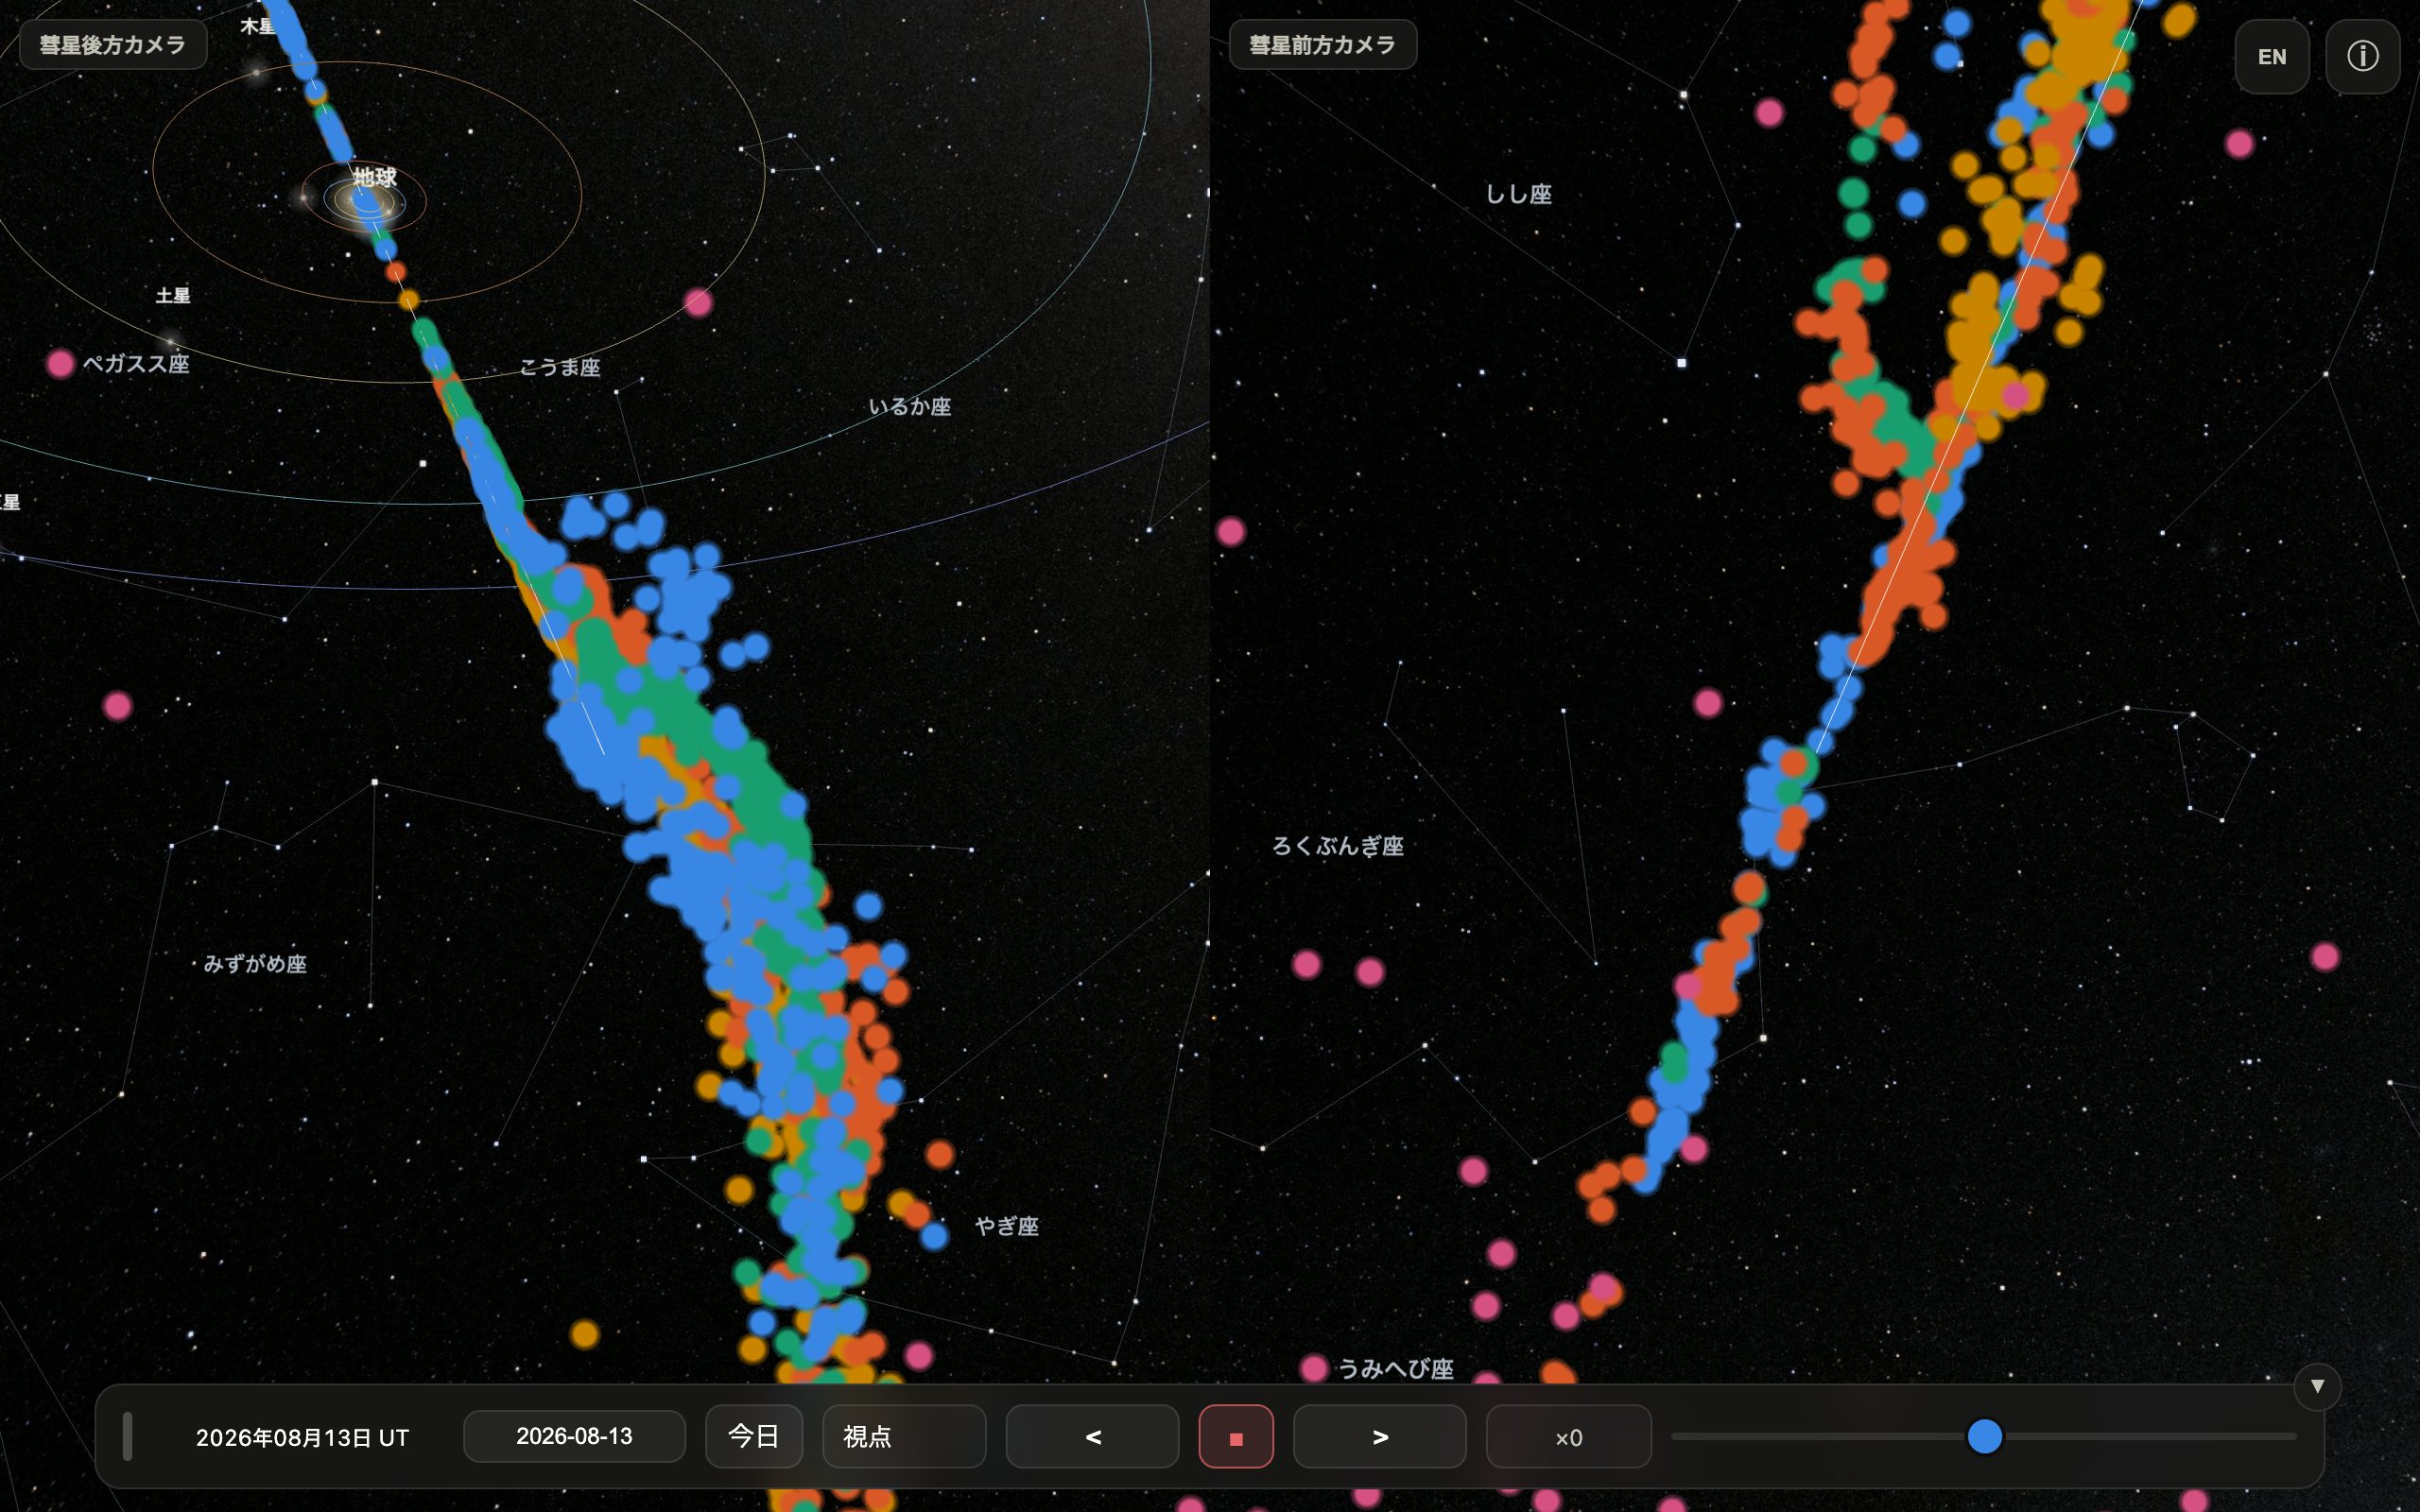
| 彗星 | 彗星と一緒に移動。押すたびに ①前方カメラ → ②後方カメラ → ③2画面(左=後方/右=前方)→ ①。左上にカメラ名を表示 |
| フリー視点 | 10秒ごとに視点と倍率が自動で移り変わる観賞モード。 再度押すかドラッグで停止 |
地球視点に入ると放射点・星座線・星座名が自動 ON、離れると放射点は自動 OFF になります。
地球視点の流星ショー
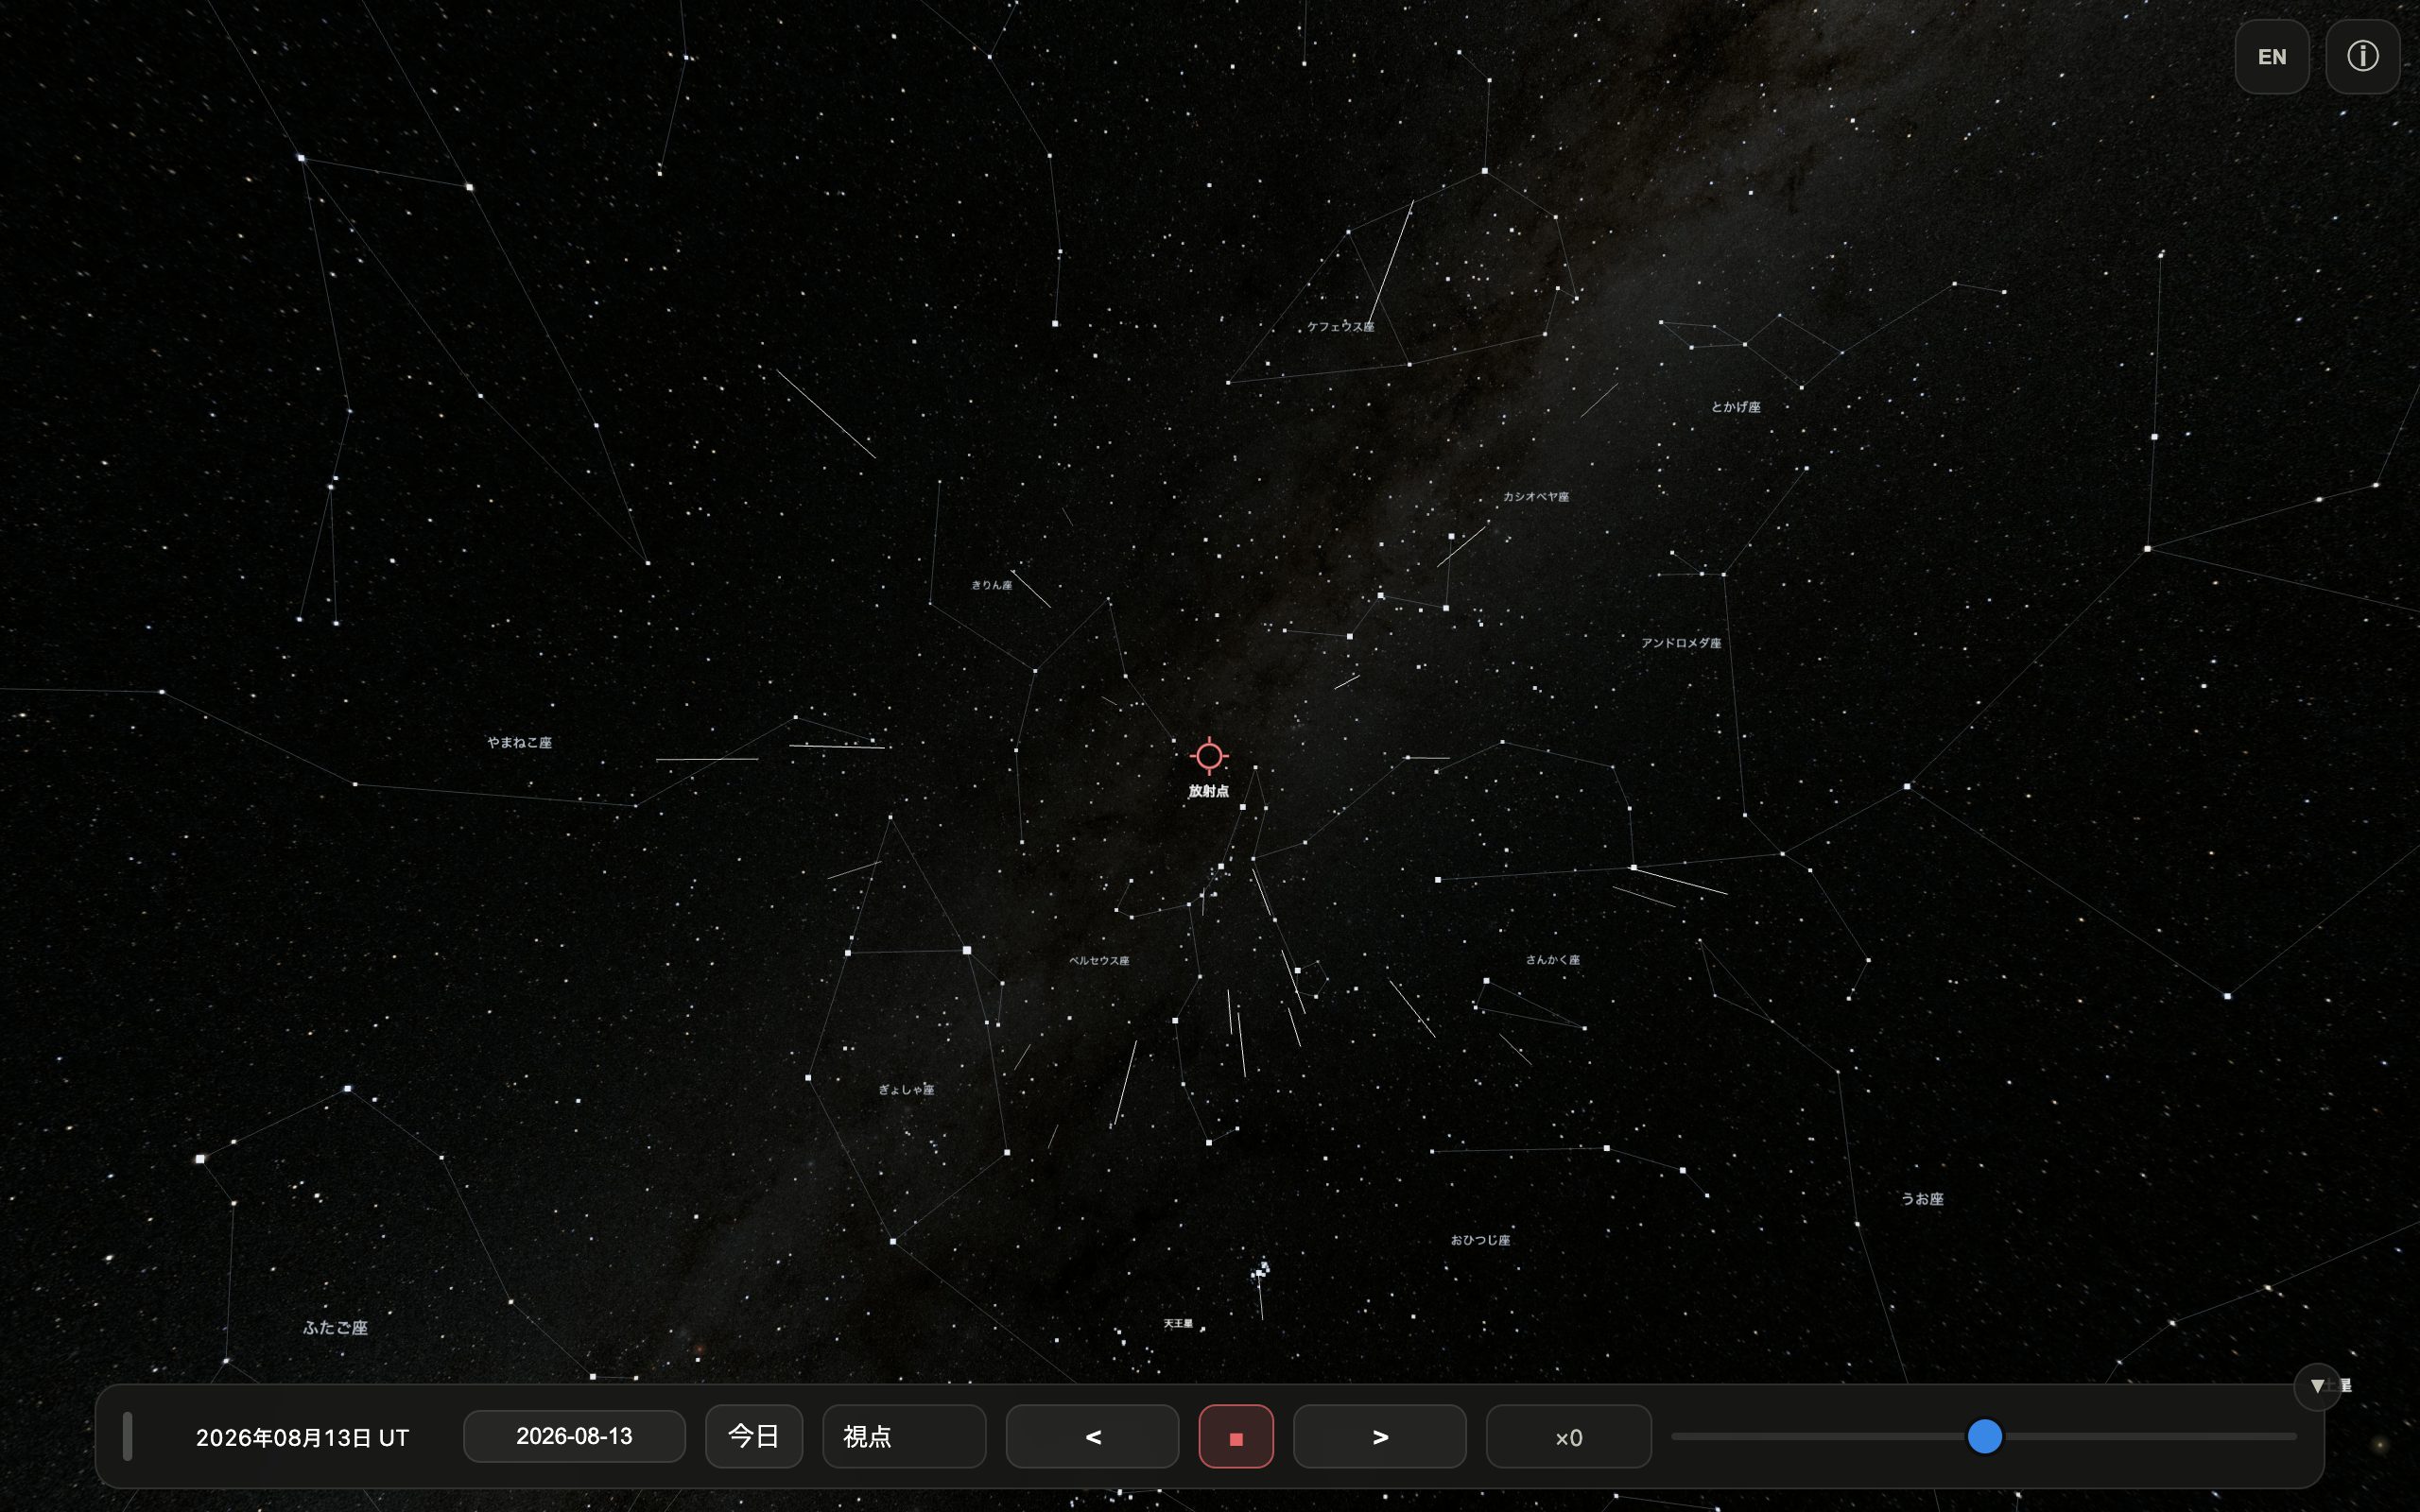
- 表示は ZHR=5,000 相当。流星は全天に出現し、経路の延長は必ず放射点を通ります
- 放射点付近では遅く・短く・太く明るく、離れるほど速く・長く・細く暗く(実際の遠近効果)
- 火球(約7%): ひときわ明るい大流星。あとに永続痕(漂う光の筋)を残すことがあります
- 流星クラスター(約4%): 数秒間に多数の流星が同じ領域から平行に流れる珍現象
- 静止流星(約2%): 放射点の真芯で、動かない点がふっと光る「正面から来る流星」
- 惑星は実際の色と等級で表示(金星は明るく、海王星はほぼ見えません)
時間操作
- 日付欄に任意の日付を入力(紀元前はマイナス年)。「今日」で現在へ
- ■: 押すと停止、もう一度押すと実時間(×1)で進行
- < / >: 押すたびに ×2 → ×10 → ×100 → ×500 → ×1000 → ×5000 → ×10000
- スライダー: 中央=停止、左右で無段階の速度調整
粒子設定・言語
表示粒子数 10/25/50/100%(重い端末では減らしてください)、サイズ 大/中/小。 右上のボタンで日本語⇄英語を切り替えます。
バージョン 1.1 の新機能
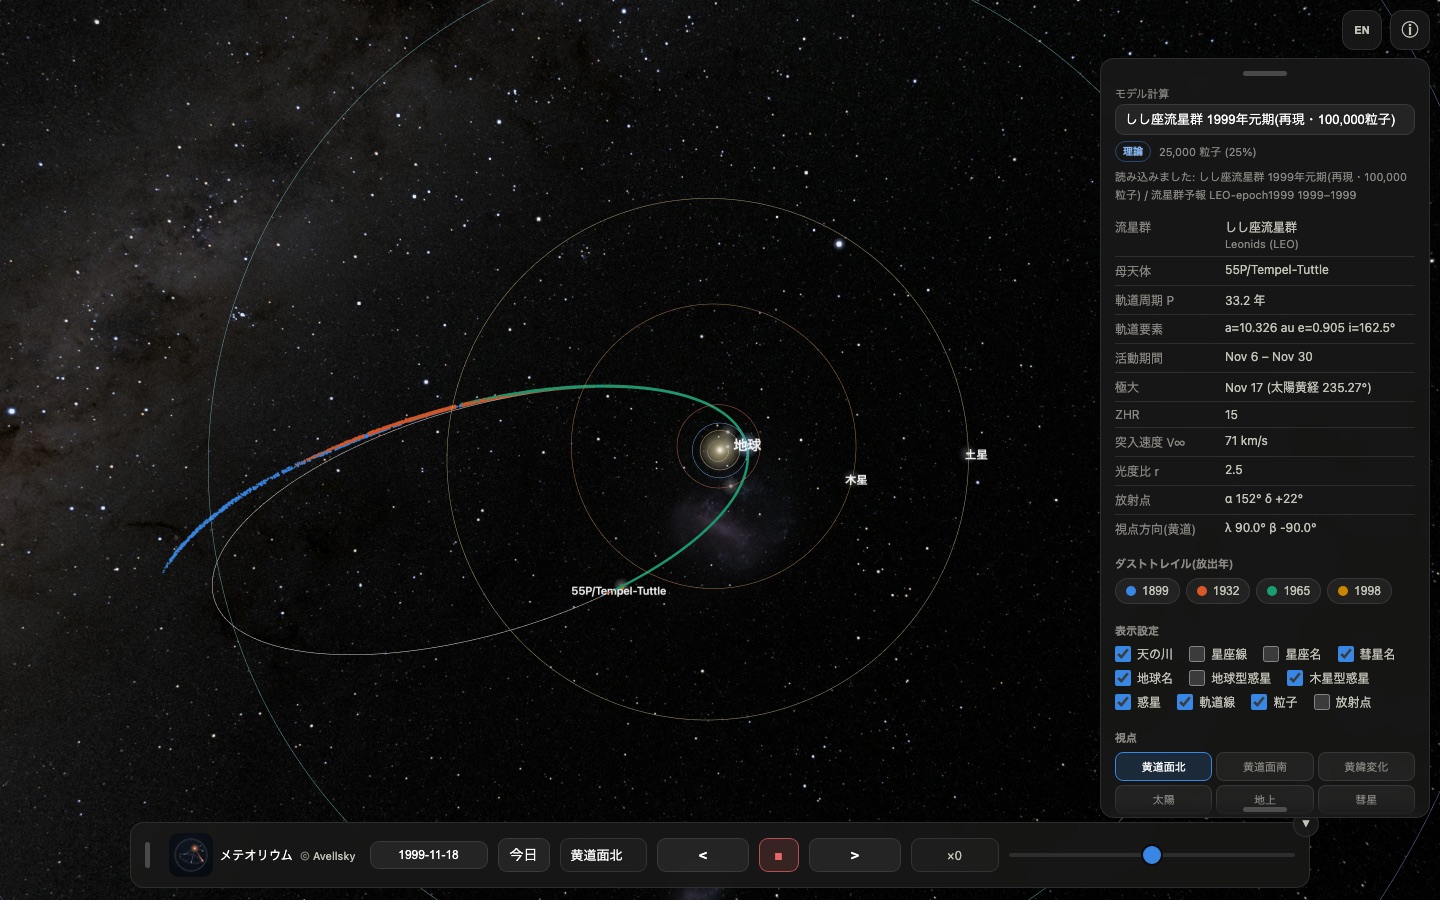
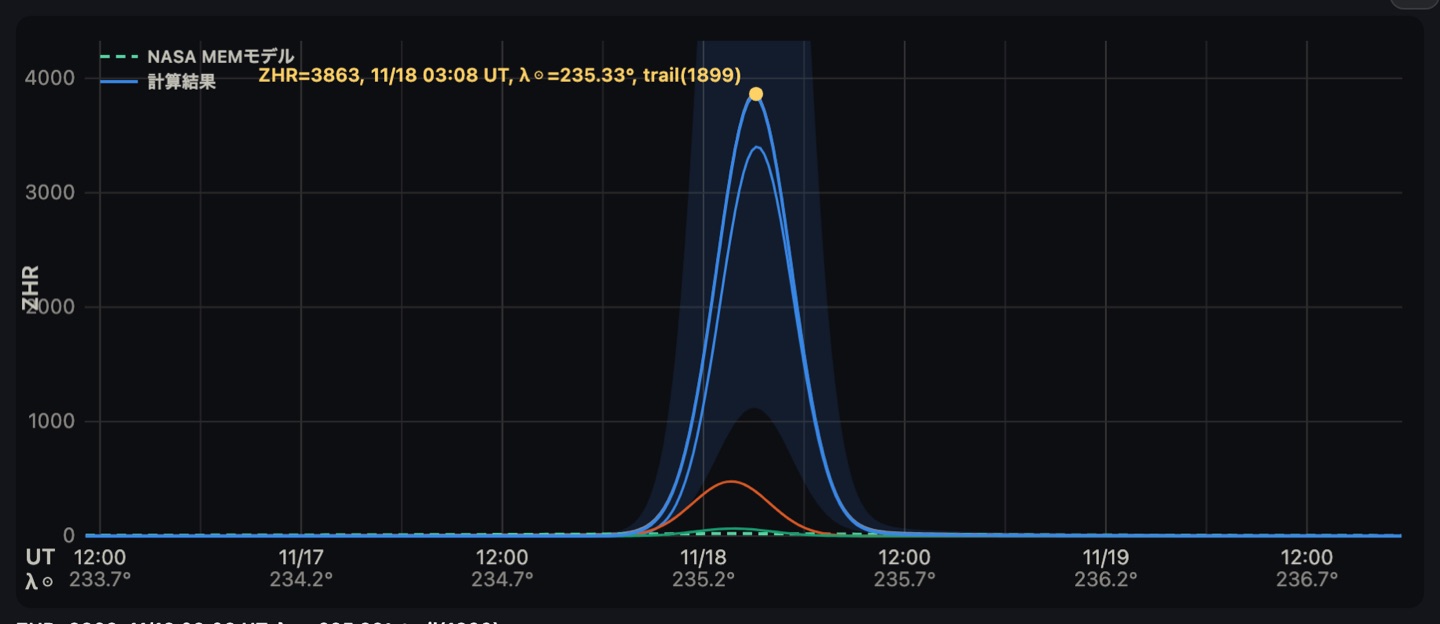
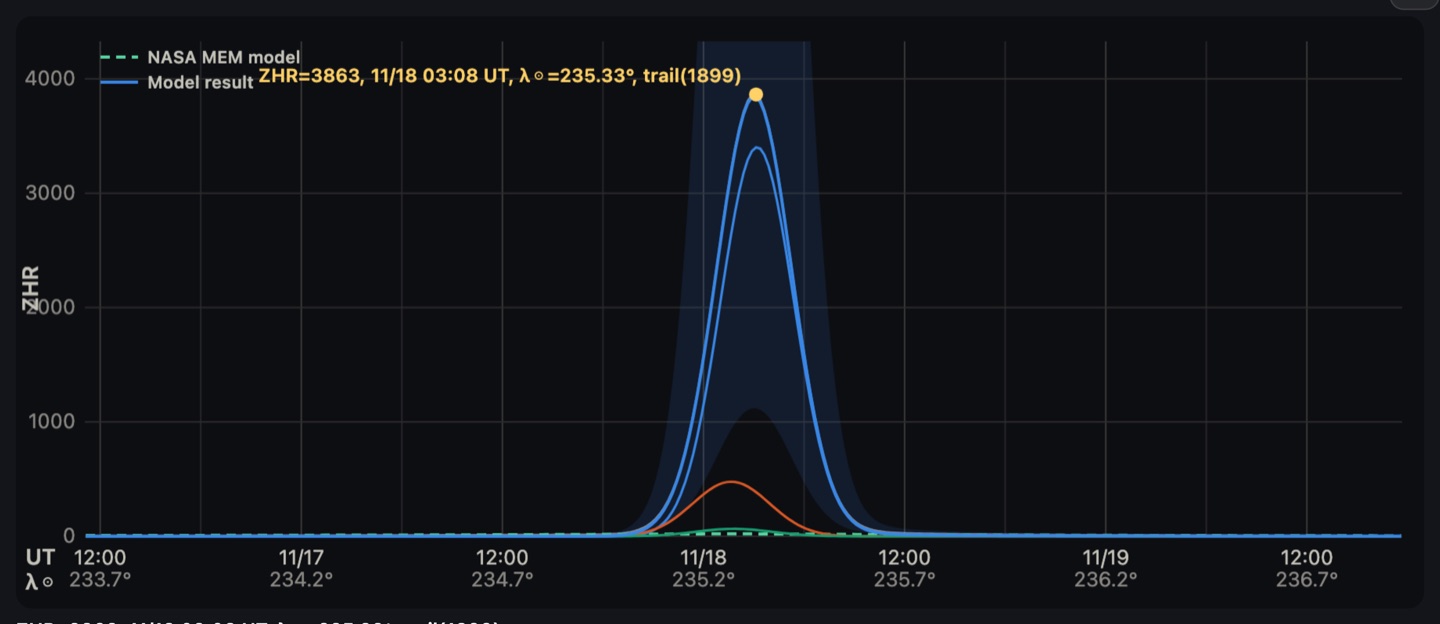
1.1 では、論文の計算結果そのものをアプリの中で開けるようにしました。以下は 1999 年 11 月 18 日のしし座流星群の大出現について、公開データから読み込んだ モデルの予報と、実際の観測結果を突き合わせたものです。
公開データを直接読み込める
「モデル計算」のメニューに 「公開データを取得…」 が加わりました。押すと 論文で公開しているしし座流星群のデータセット一覧が出て、選ぶとその場で取り込まれます。 1998・1999・2000・2001・2002 年の元期整合データと 2009 年のデータが選べます。 データを選ぶと予報年も自動で設定されます。
しし座流星群 2030–2035 年の予報を収録
論文の 2030 年代の予報を、アプリを開いたその場で見られます。各年は論文と同じく 遭遇年ごとに元期を合わせたデータから計算した値です。
ダストトレイル断面図は 2 種類
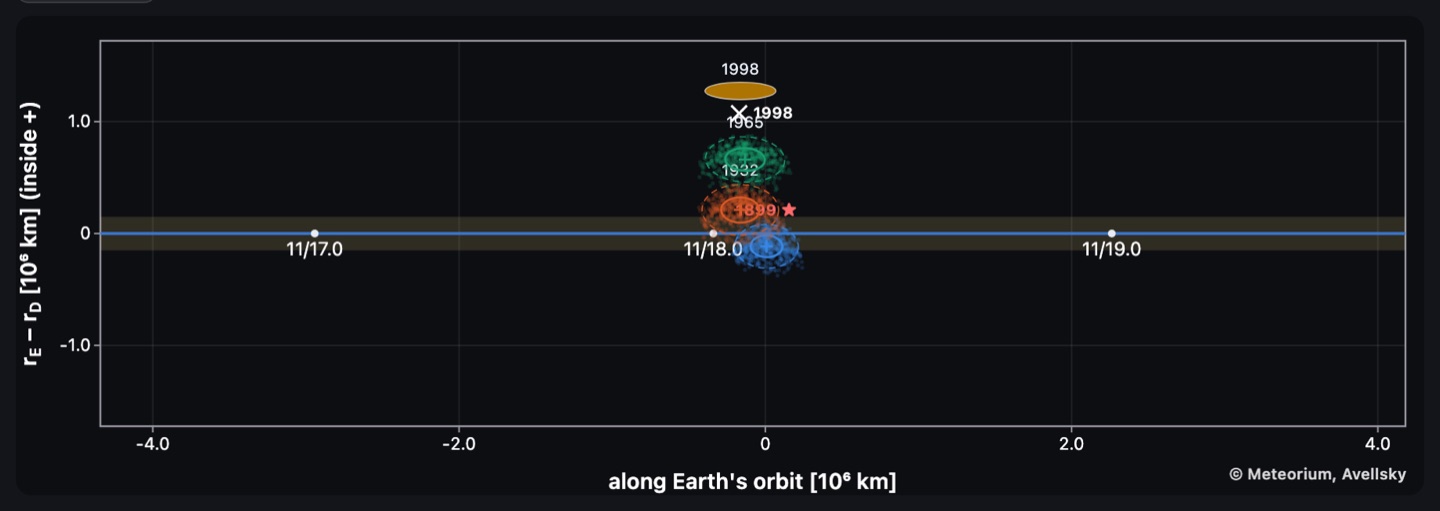
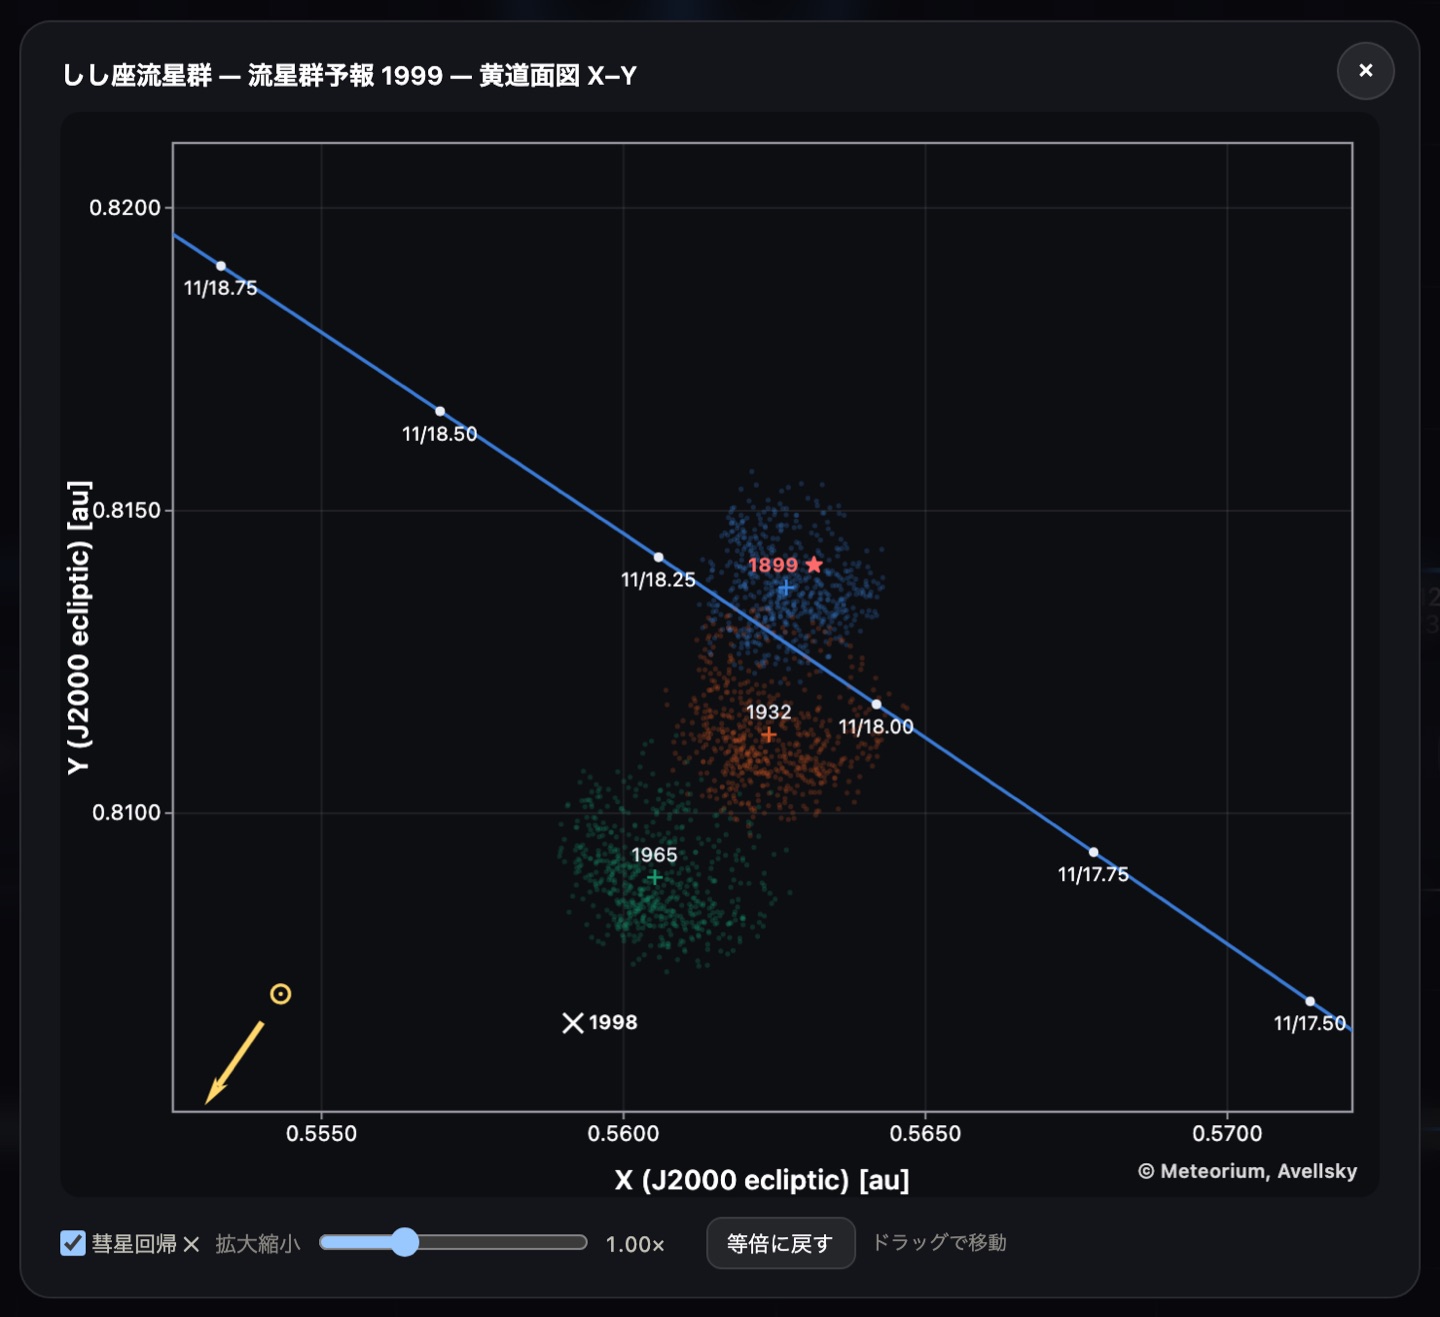
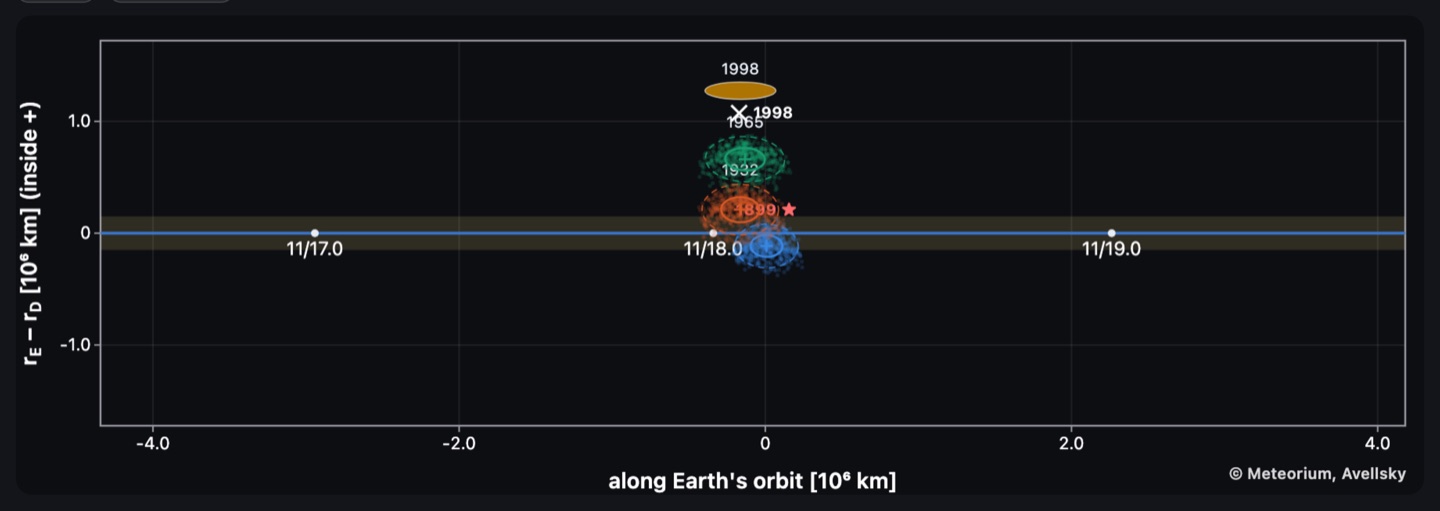
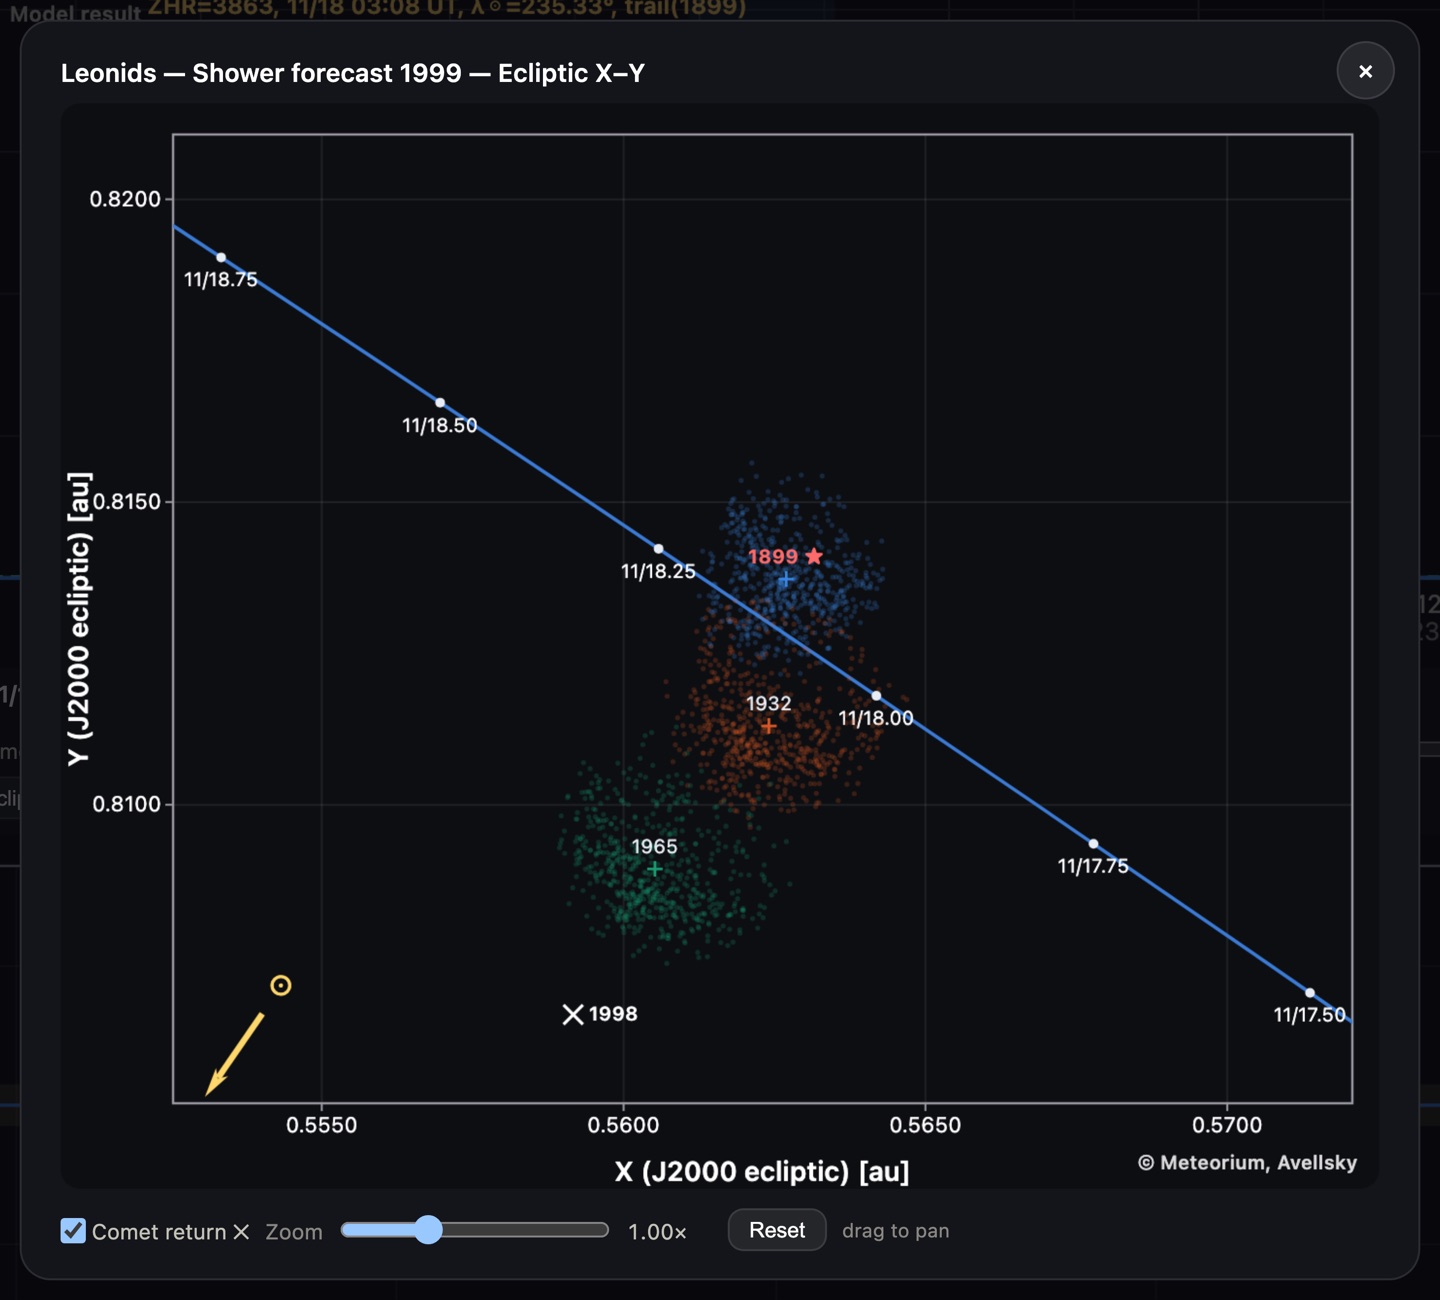
地球がトレイルのどこを通り抜けるのかを、2 つの図で確かめられます。
そのほかの変更
- 下部バーの視点メニューが、いま選ばれている視点の名前を表示するようになりました
- 「地上」の視点で、流星の出現頻度を ZHR 100 / 1000 / 5000 / 10000 / 100000 から選べるようになりました。1999 年のような大出現の空を再現できます
- データセット名を分かりやすくしました(元期・粒子数の表記を統一)
流星群予報
ペルセウス座流星群の 2026 年の予報と、しし座流星群の 2030–2035 年の予報を収録しています(「モデル計算」のメニューから、論文で公開しているデータをさらに取り込むこともできます)。ZHR プロファイル(NASA MEM モデル/計算結果の分離表示、ダストトレイル別の色分け寄与)、ダストトレイル断面図(粒子散布と 1σ/2σ 誤差楕円)、黄道面図 X–Y を表示できます。予報値はあらかじめ計算したものを収録しており、本アプリに計算機能そのものは含まれません。
予報モデルについて
ダストトレイル予報は、母彗星の各近日点回帰で放出された塵を N 体積分 (REBOUND/ReboundX、惑星摂動・輻射圧・ポインティング–ロバートソン効果)で現在まで 追跡し、地球軌道との交点(ノード)での遭遇を評価します。
- 放出モデル: Crifo & Rodionov (1997) のガス抗力終端速度則、サイズ分布 dN ∝ a−u からの直接抽選、輻射圧パラメータ β = 5.74×10⁻⁴/(ρa)
- 母彗星の位置: 塵の放出地点は JPL Horizons 暦(回帰ごとの観測フィット解)に 基準を合わせています。自前の逆積分では 55P の場合 130 年で 0.08–0.15 au、1700 年以前 では 1 au 以上ずれ、これがトレイル位置の系統誤差になるためです
- 年間背景: NASA MEO(Moorhead et al. 2019)の実測活動プロファイル
- 信頼度クラス: 予報値には A(0.5–2.0 倍)/ B(0.29–3.5 倍)/ C(0.1–10 倍)の 幅を付記します。クラスは流星群ごとに過去事例の再現成績から決めています
各流星群の諸元(活動期間・極大・ZHR・V∞・光度比 r・放射点)は IMO Meteor Shower Calendar に準拠しています。
予報モデルの出典
しし座流星群の予報モデルと 2030–2035 年の予報値は、次の論文に基づいています。 本稿は現在 Icarus に投稿中です。
Shinsuke Abe (2026) “A calibrated dust-trail model of the Leonid meteoroid stream and forecasts of the 2031–2035 encounters”, submitted to Icarus.
各年の予報は、論文と同じく遭遇年ごとに元期を合わせたデータセットから計算した 値を収録しています。単一のスナップショットから全年を読むと、惑星摂動でトレイルの節が 動いた分が反映されず、2034 年はどちらのトレイルが優勢かが入れ替わります。計算に使った データセットは Zenodo で公開しています(DOI: 10.5281/zenodo.22004211)。
English Manual
Meteorium visualises the dust trails behind meteor showers in 3D, based on real orbital dynamics. This app ships with 60,000 dust grains from eight perihelion returns (1079–1992) of comet 109P/Swift-Tuttle, the parent of the Perseids, integrated with REBOUND/ReboundX (planetary gravity + solar radiation pressure) against NASA's Deep Star Maps 2020. All computation runs on your device; no data collection, no ads.
Basics
- Drag to rotate, pinch/wheel to zoom. Panels move by their grips.
- The ▼ button on the bottom bar collapses it to a single ▲ button; in landscape the speed slider gets its own full-width row, and rotating the device always brings the panels back on screen.
- Trail legend chips toggle each ejection-year trail.
- Display toggles: Milky Way, constellation lines/names, comet/Earth labels, terrestrial/giant planet names, planets, orbit lines, particles, radiant.
Viewpoints
- Ecliptic N/S — top/bottom view, each press rotates 45°.
- Ecl. latitude — fixes the current longitude, steps latitude by 30°.
- Sun — pinned to the Sun; presses cycle vernal equinox → comet tracking → Earth tracking (caption top-left; tracking survives drags).
- Earth — ground view toward the radiant with a live meteor shower (ZHR 5,000) during the activity period (Jul 17 – Aug 24): meteors all over the sky, perspective-true speeds and brightness, fireballs with persistent trains, meteor clusters, stationary meteors, and planets at true colour/magnitude.
- Comet — rides the comet; presses cycle front → rear → split screen (rear|front) with captions.
- Free view — an auto tour changing view and zoom every 10 s.
Time
Date entry (BC as negative years), Today, ■ toggles stop ⇄ real time (×1), arrows step ×2 → ×10 → … → ×10000, stepless slider.
What's new in 1.1
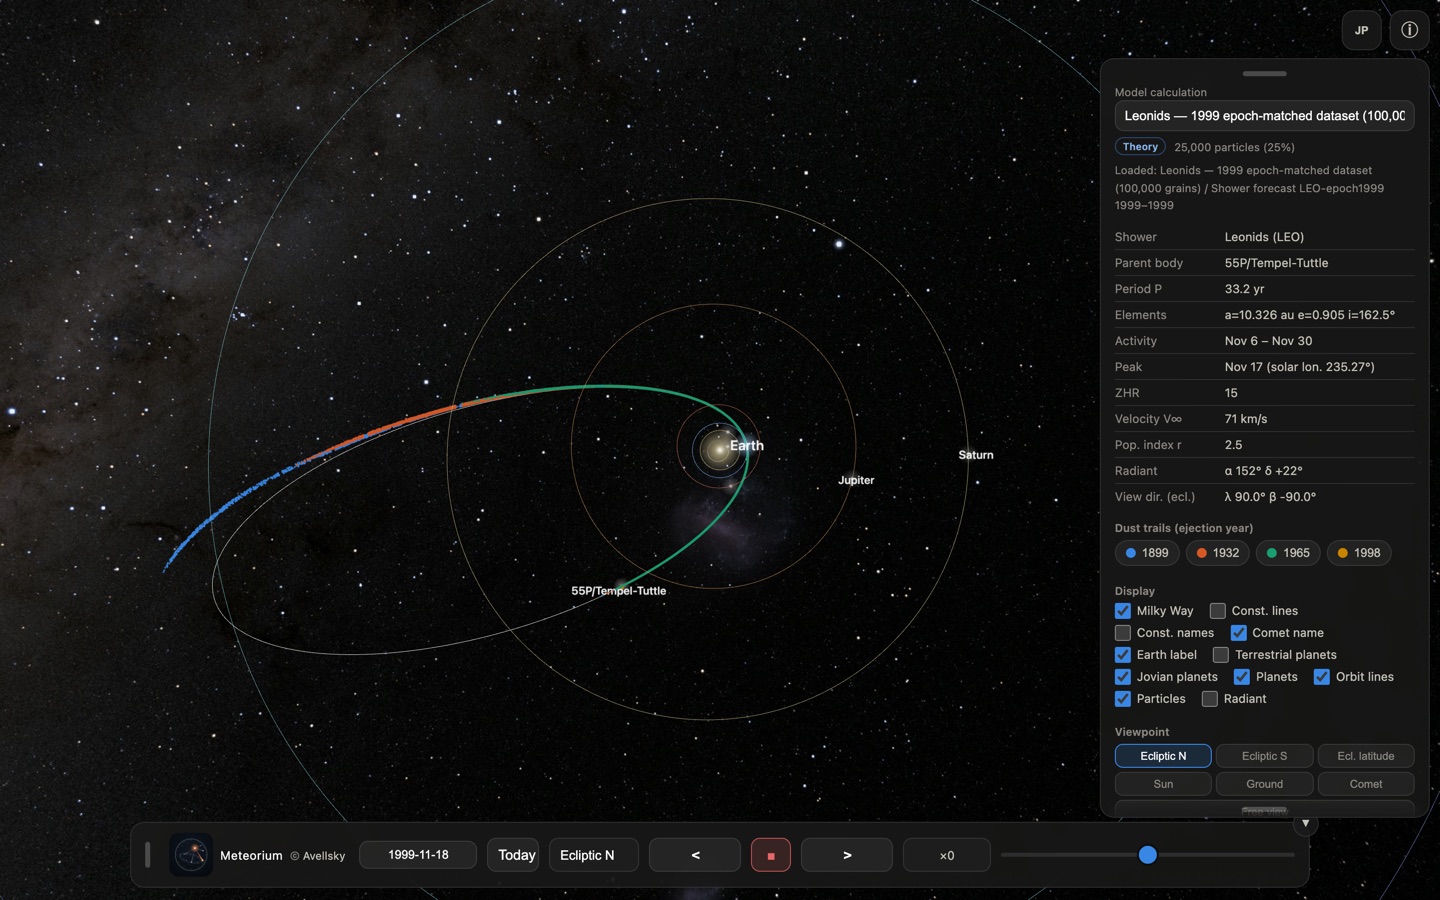
Version 1.1 opens the paper's own results inside the app. The figures below set the model's forecast for the 1999 November 18 Leonid storm, loaded from the published data, against what was actually observed that night.
Published data, loaded in the app
The Model calculation menu now offers Fetch published data…. It lists the Leonid datasets published with the paper — the epoch-matched simulations for 1998, 1999, 2000, 2001, 2002 and 2009 — and pulls in whichever you pick. Choosing a dataset also sets the forecast year for you.
The Leonid forecasts for 2030-2035
The manuscript's 2030s forecasts ship with the app. Each year is computed, as in the manuscript, from a dataset matched to that encounter's epoch.
Two cross-section views
Two figures show where in the trail the Earth actually passes.
Also in 1.1
- The viewpoint menu on the bottom bar now shows which viewpoint is in effect.
- In the ground view the meteor rate can be set to ZHR 100 / 1000 / 5000 / 10000 / 100000, so a storm sky like 1999 can be reproduced.
- Clearer dataset names (epoch and grain count written the same way throughout).
About the forecast model
Trail forecasts integrate the dust released at each perihelion return of the parent comet forward to the present with REBOUND/ReboundX (planetary perturbations, radiation pressure, Poynting–Robertson drag), then evaluate the encounter at the trail's ecliptic node.
- Ejection: Crifo & Rodionov (1997) gas-drag terminal-speed law, sizes drawn directly from dN ∝ a−u, radiation-pressure parameter β = 5.74×10⁻⁴/(ρa)
- Parent position: dust ejection sites are anchored to the JPL Horizons ephemeris, which uses an orbit solution fitted to each historical apparition. A self-consistent back-integration of 55P instead drifts 0.08–0.15 au over 130 yr and more than 1 au before 1700, which biases every trail generated from it.
- Annual background: measured activity profiles from NASA MEO (Moorhead et al. 2019)
- Confidence class: each forecast carries a band — A (0.5–2.0×), B (0.29–3.5×) or C (0.1–10×) — set per shower from how well the model reproduces that shower's documented past encounters.
Shower parameters follow the IMO Meteor Shower Calendar.
Source of the forecast model
The Leonid forecast model, and the 2030–2035 values shipped with the app, come from the following manuscript, currently submitted to Icarus:
Shinsuke Abe (2026) “A calibrated dust-trail model of the Leonid meteoroid stream and forecasts of the 2031–2035 encounters”, submitted to Icarus.
Each year is computed, as in the manuscript, from a dataset matched to the epoch of that encounter. Reading every year off a single snapshot instead leaves out the planetary motion of the trail nodes since then, which reverses which trail dominates the 2034 encounter. The datasets behind the computation are published at Zenodo (DOI: 10.5281/zenodo.22004211).
プライバシーポリシー / Privacy Policy
本アプリは、個人情報を含むいかなるデータも収集・送信・保存しません。完全に 通信は利用者が公開データを取得するときだけで、広告・トラッキング・解析ツール・ アカウント機能はありません。 設定はお使いの端末内にのみ保存されます。
The app does not collect, transmit, or store any data. It works fully on your device, going online only when you fetch the published datasets, with no ads, tracking, analytics, or accounts. Preferences are stored only on your device.
お問い合わせ / Contact: avellsky@gmail.com